
•If At-Risk Companies Made New Year's Resolutions ... •Week's Winners and Losers: Apple Gels, Marriott Jams •Coca-Cola's Going Flat in More Ways Than One
Wednesday, December 31, 2014
'Frozen' Will Be a Hard Act for Disney to Follow in 2015
Many Want to Slow Down, Not Stop, in Retirement
It’s time to toss away some of the old notions about working in retirement, including the reasons people do so.
According to a study by Merrill Lynch and a think tank called Age Wave, nearly three-quarters of pre-retirees over the age of 50 say their ideal retirement will involve working.
“Work in Retirement: Myths and Motivations” is a comprehensive study based on a nationally representative poll of more than 7,000 respondents that will turn “conventional wisdom on its head,” according to Andy Sieg, head of Global Wealth and Retirement Solutions for Bank of America Merrill Lynch.
“By embracing these new realities and attitudes toward work in retirement, everyone from policy makers to employers and the financial industry will be better equipped to help people pursue their goals,” Sieg said.
The study showed that while previous generations saw retirement as the permanent end of work followed by continuous leisure, the modern-day reality for many retirees and pre-retirees is a dynamic future that it defines as “the new retirement workscape.”
“This study confirms that as people live longer and healthier lives, they’ll continue to find satisfaction from work even after they retire from their primary career,” said Ken Dychtwald, founder and CEO of Age Wave.
“For many, work is an enriching experience that may not end at the age of 65 or even 70. Whether it’s continuing to do what they love, pursuing a long-desired interest or simply seeking to remain socially engaged, there’s a revolution brewing. People have come to realize that retirement doesn’t necessarily represent the end of an active life, but rather the beginning of new and exciting chapters.”
Moreover, the point here is that retirees will work not for the money as much as for plenty of other reasons. The No. 1 reason they’re working, the survey found, is “to stay mentally active.” Money came in at No. 4, after “to stay physically active,” “social connections” and “sense of identity/self-worth.”
And 80% of the working retirees said they work because they “want to;” 20% said they work because they “have to.”
When working retirees were asked to share their best advice for people who want to work in retirement, 76% said “be open to trying something new” and 73% said “be willing to earn less to do something you truly enjoy.”
Other tips include keeping up with technology, with seven times as many citing the importance of this as opposed to trying to look younger as a way to improve their ability to work in retirement.
“Baby boomers are once again redefining a life stage,” said David Tyrie, head of Retirement and Personal Wealth Solutions for Bank of America Merrill Lynch. “They’re blazing a new path through retirement that is more fulfilling, stimulating, and financially viable for themselves and their families.”
---
Related on ThinkAdvisor:
Tuesday, December 30, 2014
Under Armour Is Destined for Greatness
Comfort is the main criterion for an athlete before choosing any apparel. Athletic-apparel giants are therefore constantly innovating more and more new products to create a niche in customers' hearts. Founded in 1996 by Kevin Plank, Under Armour Inc. (UA) is an American sports clothing and accessories company. This Baltimore-based company develops sportswear, casual apparel, footwear and a number of sport accessories. Under Armour is having its European headquarters in Amsterdam and other additional controlling centres are in Toronto, China, Hong Kong and in Guangzhou, China. The company also sponsors a number of high-level and professional athletes.
Going By the Numbers
By any measure, the first-quarter results posted by Under Armour were incredible. Quarterly revenue rose 36% year over year to $642 million, handily exceeding expectations for sales of $598.81 million. More specifically, Under Armour's apparel revenue increased 33% to $459 million, footwear sales rose 41% to $114 million, and accessories increased 43% to $52 million.
Higher-margin direct-to-consumer revenue grew 33% during the same period — and now represents 26% of all sales. Under Armour's global ramp-up is just beginning, with international sales rising 79% during the same year-ago period to comprise 9% of total first-quarter revenue.
Competition Faced
In terms of growth, there may not be a better performing company in the retail segment than Under Armour. The maker of athletic apparel, footwear, and accessories has excelled on numerous fronts in recent years. However, the company's robust growth is derived directly from the immense strength of the Under Armour brand itself, which has proven more universally appealing than the brands of industry rivals like Lululemon Athletica (LULU).
Social media can be an effective way to gauge brand popularity. In the case of Under Armour versus Lululemon, the comparison is especially valuable because the companies are approximately the same size; Under Armour's market capitalization is $9.2 billion and Lululemon's market capitalization is $8.5 billion.
Despite being roughly the same size, Under Armour has more than three times the amount of fans on Facebook (FB) that Lululemon has. The former has more than 2.7 million fans, while the latter has just and 891,000.
Targeting Female Athletes
Under Armour has a more diverse product lineup that appeals to a much broader audience. While the company's brand originally catered primarily to male athletes in sports like football, Under Armour management has made great strides in targeting female athletes as well as youth in recent years.
Under Armour has embarked on a campaign called "What's Beautiful," which has targeted female athletes through various print, television and social-media advertisements over the last year. The strategy focused on consumer engagement and allowed fans to post their workout routines and progress online. The company has also introduced new female product lines and redesigned a number of stores with female shoppers in mind.
Currently, growth in Under Armour's female apparel is outpacing the company's overall growth and indicates that management's efforts have been very successful. Chief executive officer Kevin Plank is anticipating that Under Armour's female businesses will make up $1 billion in revenue by 2016.
The diversification strategy has been so successful that Plank explained during a recent investor conference call, "Women's has the potential to be larger than men's."
Growth Prospects
Under Armour has the most room for growth and is the best long-term growth play. Under Armour has the brand strength and management team to make the company a worldwide leader in athletic apparel and footwear. All that is necessary for the company to succeed is to translate its immense brand strength into other product segments and geographic areas. Luckily, management at Under Armour has already shown that it is capable of doing this. Despite a fantastic 2013, Under Armour should still shine in 2014.
Meanwhile, in China, Under Armour is expected to have roughly twenty stores by the end of April and a total of fifty in the pipeline for the rest of the year. Through this expansionary move, the organization will increase its presence in China from two cities to ten.
Additionally, Under Armour also made a debut in Chile and Brazil earlier on during the year, and its growth in South America was supplemented after it took full control of a distributor in Mexico that used to be a subsidiary of theirs.
Towards the end of 2014, Under Armour aspires to initiate the distribution in markets that they had not explored before, such as the Middle East and South-east Asia.International business has always been one of their key sources of revenue, in addition to their running footwear and apparel categories.
Apart from introducing new products and increasing sports sponsorships, Under Armour is also making technological advancements in its product offerings.
To End
Nowadays, activewear is becoming a hot fashion statement and is gaining acceptance as a wearable attire at almost every thinkable venue, including some offices. Under Armour is capitalizing on this growing trend by offering highly technical activewear products for men, women and youth. It is emerging as a big player in the sports apparel industry.
Under Armour has huge revenue growth followed by strong financial position. It also has an impressive record of earnings per share growth, compelling growth in net income, and solid stock price performance. Under Armour shows all the potential to continue as a growth stock. It also has its plan intact for the Winter Olympics and is making consistent improvements in its technology. This will help Under Armour to get more sports contracts in future.
| Currently 3.00/512345 Rating: 3.0/5 (2 votes) | Voters: |
 Subscribe via Email
  Subscribe RSS Comments
  Dr. Paul Price
  - 14 hours ago
 What is UA worth, and how did you derive that value?
Without a goal price or fair value, how can you know if it is a good buy?
Please leave your comment:More GuruFocus Links
| Latest Guru Picks | Value Strategies |
| Warren Buffett Portfolio | Ben Graham Net-Net |
| Real Time Picks | Buffett-Munger Screener |
| Aggregated Portfolio | Undervalued Predictable |
| ETFs, Options | Low P/S Companies |
| Insider Trends | 10-Year Financials |
| 52-Week Lows | Interactive Charts |
| Model Portfolios | DCF Calculator |
RSS Feed  | Monthly Newsletters |
| The All-In-One Screener | Portfolio Tracking Tool |
 MORE GURUFOCUS LINKS
 | Latest Guru Picks | Value Strategies |
| Warren Buffett Portfolio | Ben Graham Net-Net |
| Real Time Picks | Buffett-Munger Screener |
| Aggregated Portfolio | Undervalued Predictable |
| ETFs, Options | Low P/S Companies |
| Insider Trends | 10-Year Financials |
| 52-Week Lows | Interactive Charts |
| Model Portfolios | DCF Calculator |
| RSS Feed | Monthly Newsletters |
| The All-In-One Screener | Portfolio Tracking Tool |
 46.57 (1y: -22%) $(function(){var seriesOptions=[],yAxisOptions=[],name='UA',display='';Highcharts.setOptions({global:{useUTC:true}});var d=new Date();$current_day=d.getDay();if($current_day==5||$current_day==0||$current_day==6){day=4;}else{day=7;} seriesOptions[0]={id:name,animation:false,color:'#4572A7',lineWidth:1,name:name.toUpperCase()+' stock price',threshold:null,data:[[1368162000000,59.85],[1368421200000,59.43],[1368507600000,60.61],[1368594000000,61.38],[1368680400000,61.39],[1368766800000,62.51],[1369026000000,62.08],[1369112400000,64.3],[1369198800000,63.56],[1369285200000,63.01],[1369371600000,62.54],[1369717200000,63.29],[1369803600000,62.74],[1369890000000,62.74],[1369976400000,62],[1370235600000,61.75],[1370322000000,61.54],[1370408400000,59.64],[1370494800000,59.45],[1370581200000,59.82],[1370840400000,60.04],[1370926800000,59.6],[1371013200000,59.04],[1371099600000,59.39],[1371186000000,59.18],[1371445200000,59.47],[1371531600000,60.06],[1371618000000,59.68],[1371704400000,57.72],[1371790800000,56.82],[1372050000000,56.68],[1372136400000,57.5],[1372222800000,57.75],[1372309200000,58.46],[1372395600000,59.71],[1372654800000,60.08],[1372741200000,60.02],[1372827600000,60.76],[1373000400000,61.22],[1373259600000,61.58],[1373346000000,61.68],[1373432400000,61.81],[1373518800000,60.35],[1373605200000,60.8],[1373864400000,60.86],[1373950800000,59.82],[1374037200000,60.34],[1374123600000,61.11],[1374210000000,61.53],[1374469200000,61.47],[1374555600000,61.9],[1374642000000,61.83],[1374728400000,69.38],[1374814800000,68.53],[1375074000000,67.66],[1375160400000,67.83],[1375246800000,67.13],[1375333200000,69.5],[1375419600000,69.13],[1375678800000,69.27],[1375765200000,70.04],[1375851600000,69.5],[1375938000000,71.98],[1376024400000,72.69],[1376283600000,73.93],[1376370000000,74.07],[1376456400000,73.3],[1376542800000,70.6],[1376629200000,68.93],[1376888400000,70.67],[1376974800000,71.51],[1377061200000,72.45],[1377147600000,72.2],[1377234000000,73.16],[1377493200000,73.86],[1377579600000,72.07],[1377666000000,72.35],[1377752400000,73.32],[1377838800000,72.64],[1378184400000,74.13],[1378270800000,74.79],[1378357200000,76.89],[1378443600000,77.2],[1378702800000,79.31],[1378789200000,80.06],[1378875600000,81.17],[1378962000000,80.59],[13790484! 00000,78.5],[1379307600000,75.44],[1379394000000,76.82],[1379480400000,77.96],[1379566800000,77.64],[1379653200000,77.88],[1379912400000,77.18],[1379998800000,77.59],[1380085200000,77.81],[1380171600000,79.11],[1380258000000,79.99],[1380517200000,79.45],[1380603600000,82.69],[1380690000000,82.4],[1380776400000,80.88],[1380862800000,81.11],[1381122000000,79.39],[1381208400000,76.35],[1381294800000,77.54],[1381381200000,79],[1381467600000,78.37],[1381726800000,79.2
Monday, December 29, 2014
No Joke: An April Fool’s Day High for the S&P 500
It’s April Fools’ Day, but the joke is on the bears as stocks gained today, led by Intuitive Surgical (ISRG). TripAdvisor (TRIP), Cisco Systems (CSCO), Boeing (BA) and Walt Disney (DIS).

The S&P 500 gained 0.7% to 1,885.52 today, a new record high and its seventh of the year. The Dow Jones Industrial Average rose 0.5% to 16,532.61, its second highest close ever and just 0.3% from a new high.
The Dow was given a boost by Cisco Systems, which gained 3.9% to $23.10, Boeing, which rose 2.2% to $128.21 after finalizing an order for new planes, and Disney, which advanced 1.9% to $81.57. The S&P 500′s biggest gainers included Intuitive Surgical, which rose 13% to $493.60 after the FDA approved a new robot device, and TripAdvisor, which gained 5.5% to $95.55.
April Fools’ Day has been historically strong for stocks, notes S&P Dow Jones Indices’ Howard Silverblatt. He explains:
The market continued its move-up from yesterday (helped by Yellen's remarks), setting its seventh new closing high year-to-date…The market also set a new closing high on April 1, 1998, and then beat that high the next day. Guess April fool's day is lucky – 42 of 62 historically are up.
BofA Merrill Lynch’s Stephen Suttmeier reminds investors that April has historically been strong:
Seasonals are bullish in April. Going back to 1928, the S&P 500 is up 62.8% of the time in April. With an average return of 1.25%, April is the 4th best month of the year (side bar). But seasonals turn riskier beginning in May, especially during the mid-term year of the Presidential Cycle.
Morgan Stanley Wealth Management’s Michael Wilson thinks earnings will have to do the heavy lifting now that the Fed has started to move:
Every economic cycle is different, but as they evolve, they generally share many of the same characteristics. Most recently, the US economic recovery passed a significant milestone—the point at which the Federal Reserve deems it appropriate to tighten monetary policy. One of the ways this cycle has been different is that the Fed has used a new monetary-stimulus tool: Quantitative Easing (QE). In December, the Fed announced it was time to wind down QE. With respect to the economic cycle, this is no different than the Fed's first rate hike after a recession. While this creates some uncertainty, we believe the Fed has it right, and it is time to remove monetary stimulus because the economy can now stand on its own…
Does this mean we should expect equity markets to continue to boom? Not necessarily. Equity markets rallied quite strongly last year, in part anticipating the Fed's affirmation that the recovery could be self-sustaining. Instead, we should expect equity markets to continue to rise more in line with earnings growth, as valuations are now fair. It's no coincidence that valuation measures peaked in December when the Fed announced it would begin tapering QE. To us, this suggests equity returns closer to 7% to 8% in the US and not the 20%-plus average annual return we have enjoyed during the past five years.
After the rocky start to the year, we’ll take it.
Sunday, December 28, 2014
Stocks Hitting 52-Week Highs
Novavax (NASDAQ: NVAX) shares surged 9.85% to touch a new 52-week high of $5.69 after the company announced the continuation of RSV Vaccine Partnership with Path.
XOMA (NASDAQ: XOMA) shares reached a new 52-week high of $8.61. XOMA shares have jumped 196.09% over the past 52 weeks, while the S&P 500 index has gained 25.27% in the same period.
Red Hat (NYSE: RHT) shares touched a new 52-week high of $59.28 after Morgan Stanley upgraded the stock from Equal-weight to Overweight.
Juniper Networks (NYSE: JNPR) shares jumped 7.98% to reach a new 52-week high of $25.41 following Elliott headlines.
Posted-In: 52-Week HighsNews Intraday Update Markets Movers
(c) 2014 Benzinga.com. Benzinga does not provide investment advice. All rights reserved.
Most Popular Earnings Expectations For The Week Of January 13: Big Banks, GE, Intel And More UPDATE: Stifel Downgrades Cree on Recent Performance UPDATE: JMP Securities Reiterates Coverage on ARIAD Pharmaceuticals, Sees Market Share Regain UPDATE: Bank of America Upgrades MGM Resorts International, Has Bullish 2014 Outlook Coming Soon: 3D Printing for Everyone Alcatel-Lucent CEO Says China to Become World's Largest 4G Market Related Articles (JNPR + NVAX) Market Wrap For January 13: Markets Showing Weakness Ahead Of Major Earning Releases Novavax Announces Management Promotions Elliott Management Sees Shares of Juniper Networks' Worth $35 to $40 Stocks Hitting 52-Week Highs Top Performing Industries For January 13, 2014 UPDATE: Elliott Management Announces Value Plan for Juniper Networks Around the Web, We're Loving... Lightspeed Trading Presents: Thunder and Tubleweeds: Trading Techniques for the New Market Enviroment Pope Francis Rips 'Trickle-Down' Economics Come See How the Pro's Trade in this Exclusive Webinar Wynn, MGM, Other Casino Giants Vying For U.S. Turf What Should You Know About AMZN? View the discussion thread. Partner Network View upcoming Earnings, Ratings, Dividend and Economic Calendars.As Online Shopping Grows So Do Growing Pains

Saturday, December 27, 2014
Massachusetts Regulator Finds Custody Infractions Among Switching Advisors
Of the 139 advisors that switched from federal to state registration in Massachusetts under the Dodd-Frank Act, only three had been examined by the Securities and Exchange Commission in the years before the law took effect, and the state has found custody infractions among the switching advisors it has examined.
So says a new report released by Massachusetts securities regulator William Galvin. The Massachusetts Securities Division so far has examined half of the Massachusetts-based advisors that switched.
The state says investment advisors’ custody of clients’ funds or securities has been a “common deficiency.”
To this end, Galvin released a policy statement Thursday to make clear that the investment advisors who register with the Division in the wake of the Dodd-Frank Act must follow the “stricter” state rules on reporting when they have custody of client funds.
“In many instances, advisors unknowingly possessed custody of clients’ trust assets due to the advisor or a related person’s position as a trustee of the trust,” according to the report. “Many of the advisors deemed by the Division to have custody failed to disclose that in their regulatory filing, nor have they had a surprise independent audit as required by state rules."
“With the recent Madoff scandal we have all seen the risks that can occur when an adviser abuses custody authority,” said Galvin, in a statement.
The policy statement sets out the Division’s custody requirements and specifically states that the Division does not follow the SEC exemption from custody for appointments of supervised persons of an advisor as executors, conservators or trustees that arise as a result of family or personal relationship with the decedent, beneficiary or grantor.
Advisors directly deducting advisory fees from client accounts are deemed to have custody unless they comply with certain additional requirements, the policy statement says.
The policy statement says that state-registered investment advisors “must comply with the custody rules as spelled out in the federal Investment Advisers Act of 1940, specifically Rule 206(4)-2 which requires, among other things, an annual surprise audit of advisors by an independent public accountant.”
While this will mean additional costs to registered investment advisors, the “cost is outweighed by the additional protections these measures afford to investors,” the Division said.
---
Check out SEC: Don’t Use ‘Protected’ or ‘Guaranteed’ in Fund Names on ThinkAdvisor.
5 Breakout Trades to Buy This Week
BALTIMORE (Stockpickr) -- U.S. stocks bounced hard yesterday, the S&P 500 making its way a full percentage point higher by the time the closing bell rang. That's adding quite a bit of support for the market picture I shared on Thursday.
Yes indeed, stocks are bouncing in September, and that's creating tradable opportunities for investors right now.
That's why we're taking a technical look at five stock trades to take this week.
For the unfamiliar, technical analysis is a way for investors to quantify qualitative factors, such as investor psychology, based on a stock's price action and trends. Once the domain of cloistered trading teams on Wall Street, technicals can help top traders make consistently profitable trades and can aid fundamental investors in better planning their stock execution.
So, without further ado, let's take a look at five technical setups worth trading now.
CGG Veritas

First up is French oil service firm CGG Veritas (CGG)
. The Eurozone-based energy stock hasn't exactly posted blockbuster performance in 2013, but investors who ignore CGG for the final stretch of the year could be making a big mistake. That's because of a bullish technical pattern that's emerging in shares right now.
CGG spent most of the last eight months looking anything but bullish. But an ascending triangle pattern is changing that. The pattern is formed by horizontal resistance to the upside at $26, and uptrending support to the below shares. Basically, as CGG bounces in between those two technical levels, it's getting squeezed closer and closer to a breakout above $26. When that happens, traders have a buy signal.
The ascending triangle pattern in CGG Veritas isn't exactly textbook. That's because the setup is forming at the bottom of a downtrend, rather than in the middle of an uptrend – but it's a mistake to get caught up on the textbook pictures of what trading patterns are supposed to look like. On a move through $26, the trading implications are just as actionable.
Hasbro

We're seeing the exact same setup in shares of toymaker Hasbro (HAS) right now. Like CGG, Hasbro has a horizontal resistance level above shares – at $48 in this case – and uptrending support to the downside. The key difference here is that Hasbro's triangle is more conventional than the one in the French oil stock. A breakout above $48 is the signal to become a buyer.
Whenever you're looking at any technical price pattern, it's critical to think in terms of buyers and sellers. Triangles and other price pattern names are a good quick way to explain what's going on in this stock, but they're not the reason it's tradable – instead, it all comes down to supply and demand for shares.
That resistance line at $48 is a price where there's an excess of supply of shares; in other words, it's a place where sellers have been more eager to take recent gains and sell their shares than buyers have been to buy. That's what makes the move above it so significant – a breakout indicates that buyers are finally strong enough to absorb all of the excess supply above that price level. Wait for that signal to happen before you jump into this stock, then it makes sense to put a protective stop in place at the 50-day moving average.
Bank of New York Mellon

You don't have to be an expert technical analyst to figure out what's going on in shares of Bank of New York Mellon (BK) -- the $35 billion financial services firm is in a textbook uptrend. That's about as simple as a technical pattern gets...
BNY Mellon has had its price action bounded by trendline support to the downside, bouncing higher each of the last seven times it's been tested. That uptrending channel provides a high-probability range for price action on the way up -- and while you want to be a buyer in an uptrend, the ideal time to buy comes on a bounce off of support.
Buying off a support bounce makes sense for two big reasons: it's the spot where shares have the furthest to move up before they hit resistance, and it's the spot where the risk is the least (because shares have the least room to move lower before you know you're wrong). If you decide to buy BK on today's bounce, keep a protective stop on the other side of the trendline.
Lincoln National

Lincoln National (LNC) is a financial stock that's forming a channel of its own... But with a twist.
That's because the $12 billion wealth management firm is moving sideways in a range-bound trade called a rectangle. The setup gets its name because price action is essentially "boxed-in" by resistance above shares at $45, and support to the downside at $42. Instead of buying within the channel, rectangles are breakout trades – you want to trade this name when it breaks outside of the box.
That means that a move through the $45 level is a buy signal, and a move through support at $42 is an indicator that it's time to sell (or short) LNC. Right now, there's some extra bias to the upside – typically, rectangles are continuation patterns, and since Lincoln's preceding price action was up, it's likely next move is up as well. Still, it doesn't become a high probability trade until the breakout happens, so wait to get your direction from the market.
BHP Billiton

Last up is BHP Billiton (BHP), the ore giant from down under. BHP has been selling off over the course of 2013, down 15% at the same time that the broad market has managed to rally around 17% in the other direction. For portfolio managers whose performance is based on a benchmark, BHP has been a portfolio drag all year long. But that could be about to change...
Right now, BHP Billiton is forming an inverse head and shoulders setup, a bullish reversal pattern that indicates exhaustion among sellers. The inverse head and shoulders is formed by two swing lows that bottom out at approximately the same price level (the shoulders), separated by a deeper swing low (the head). The buy signal comes when shares push through the neckline that's acted as resistance over the course of the pattern. Since this setup has been forming in the long-term, the upside implications are long-term once it triggers...
Momentum adds some confirmation to this trade – 14-day RSI has been in an uptrend since the middle of the summer when BHP's price action was still chugging lower. A move through the neckline in September means that upside looks likely...
To see this week's trades in action, check out the Technical Setups for the Week portfolio on Stockpickr.
-- Written by Jonas Elmerraji in Baltimore.
RELATED LINKS:
>>5 Tech Stocks Spiking on Big Volume
>>5 Stocks Setting Up to Break Out
>>4 Red-Flag Stocks to Sell This Fall
Follow Stockpickr on Twitter and become a fan on Facebook.
At the time of publication, author had no positions in stocks mentioned.
Jonas Elmerraji, CMT, is a senior market analyst at Agora Financial in Baltimore and a contributor to TheStreet. Before that, he managed a portfolio of stocks for an investment advisory returned 15% in 2008. He has been featured in Forbes , Investor's Business Daily, and on CNBC.com. Jonas holds a degree in financial economics from UMBC and the Chartered Market Technician designation. Follow Jonas on Twitter @JonasElmerraji
Thursday, December 25, 2014
Today's 3 Best Stocks
Today's economic data certainly didn't seem to indicate the broad-based S&P 500 (SNPINDEX: ^GSPC ) would end the day higher, but further commentary from the Federal Reserve outweighed all that news to push us higher yet again.
The "will they or won't they" debate is really starting to weigh on investors. Ever since the Fed commented that it would consider paring back its bond-buying program of Treasuries and mortgage-backed securities, we've been whipsawed up and down. Leading that volatility are investors' interpretations of Fed Chairman Ben Bernanke's comments, and the comments of his Fed governors, which are getting blown out of proportion in both directions. Today, the comments leaned toward keeping QE3 in place, which seemed to please the markets.
On the flipside, economic data wasn't horrific, but it wasn't good, either. First-quarter GDP was revised down 0.1% from its previous estimate of 2.5% to 2.4% and weekly jobless claims rose nearly 3% to a seasonally adjusted 354,000. Both figures would suggest that a slower recovery than wanted is occurring in the U.S. economy.
As I mentioned, when all was said and done, the Fed more than outweighed today's negative economic data and pushed the S&P 500 higher by 6.05 points (0.37%) to finish at 1,654.41.
Powering the S&P 500 higher were shares of solar-panel producer First Solar (NASDAQ: FSLR ) , which rose 6.6% after receiving an upgrade from Goldman Sachs to "buy" from "hold" with a price target of $64. U.S.-based solar producers like First Solar are starting to realize the advantages of their higher-efficiency panels, with import tariffs being placed on cheaper Chinese solar panels and a combination of oversupply and huge debt levels crushing China-based manufacturers. As long as subsidies remain in place for solar conversion in the U.S., you can expect alternative energies like solar to thrive.
Heading notably higher as well, up 5.5%, was medical-products supplier CareFusion (NYSE: CFN ) which is said to be in talks as a possible acquirer of Britain-based Smiths Group's medical division. Although neither company would comment on a potential sale it would clearly be a positive for CareFusion since its revenue growth has stagnated in recent years. We should hopefully know more about these developments over the coming weeks.
Finally, storage-equipment maker EMC (NYSE: EMC ) advanced 5.4% after expanding its share repurchase program from $1 billion to $6 billion by the end of 2015. The company commented that it plans to repurchase $3.5 billion worth of shares by the end of the second quarter of 2014. Furthermore, EMC also initiated a quarterly dividend of $0.10 to give the company a projected yield of 1.6%. While great news for shareholders and certainly a testament to EMC's amazing cash flow, it also signals to investors that its high growth days may be over.
Can this stock continue to shine?
Investors and bystanders alike have been shocked by First Solar's precipitous drop over the past two years. The stakes have never been higher for the company: Is it done for good, or ready for a rebound? If you're looking for continuing updates and guidance on the company whenever news breaks, The Motley Fool has created a brand-new report that details every must know side of this stock. To get started, simply click here now.
Why Winmark's Earnings May Not Be So Hot
Although business headlines still tout earnings numbers, many investors have moved past net earnings as a measure of a company's economic output. That's because earnings are very often less trustworthy than cash flow, since earnings are more open to manipulation based on dubious judgment calls.
Earnings' unreliability is one of the reasons Foolish investors often flip straight past the income statement to check the cash flow statement. In general, by taking a close look at the cash moving in and out of the business, you can better understand whether the last batch of earnings brought money into the company, or merely disguised a cash gusher with a pretty headline.
Calling all cash flows
When you are trying to buy the market's best stocks, it's worth checking up on your companies' free cash flow once a quarter or so, to see whether it bears any relationship to the net income in the headlines. That's what we do with this series. Today, we're checking in on Winmark (Nasdaq: WINA ) , whose recent revenue and earnings are plotted below.

Source: S&P Capital IQ. Data is current as of last fully reported fiscal quarter. Dollar values in millions. FCF = free cash flow. FY = fiscal year. TTM = trailing 12 months.
Over the past 12 months, Winmark burned $4.0 million cash while it booked net income of $13.5 million. That means it burned through all its revenue and more. That doesn't sound so great. FCF is less than net income. Ideally, we'd like to see the opposite.
All cash is not equal
Unfortunately, the cash flow statement isn't immune from nonsense, either. That's why it pays to take a close look at the components of cash flow from operations, to make sure that the cash flows are of high quality. What does that mean? To me, it means they need to be real and replicable in the upcoming quarters, rather than being offset by continual cash outflows that don't appear on the income statement (such as major capital expenditures).
For instance, cash flow based on cash net income and adjustments for non-cash income-statement expenses (like depreciation) is generally favorable. An increase in cash flow based on stiffing your suppliers (by increasing accounts payable for the short term) or shortchanging Uncle Sam on taxes will come back to bite investors later. The same goes for decreasing accounts receivable; this is good to see, but it's ordinary in recessionary times, and you can only increase collections so much. Finally, adding stock-based compensation expense back to cash flows is questionable when a company hands out a lot of equity to employees and uses cash in later periods to buy back those shares.
So how does the cash flow at Winmark look? Take a peek at the chart below, which flags questionable cash flow sources with a red bar.

Source: S&P Capital IQ. Data is current as of last fully reported fiscal quarter. Dollar values in millions. TTM = trailing 12 months.
When I say "questionable cash flow sources," I mean items such as changes in taxes payable, tax benefits from stock options, and asset sales, among others. That's not to say that companies booking these as sources of cash flow are weak, or are engaging in any sort of wrongdoing, or that everything that comes up questionable in my graph is automatically bad news. But whenever a company is getting more than, say, 10% of its cash from operations from these dubious sources, investors ought to make sure to refer to the filings and dig in.
With 17.4% of operating cash flow coming from questionable sources, Winmark investors should take a closer look at the underlying numbers. Within the questionable cash flow figure plotted in the TTM period above, changes in taxes payable provided the biggest boost, at 6.2% of cash flow from operations. Overall, the biggest drag on FCF came from capital expenditures.
A Foolish final thought
Most investors don't keep tabs on their companies' cash flow. I think that's a mistake. If you take the time to read past the headlines and crack a filing now and then, you're in a much better position to spot potential trouble early. Better yet, you'll improve your odds of finding the underappreciated home-run stocks that provide the market's best returns.
Is Winmark the right retailer for your portfolio? Learn how to maximize your investment income and "Secure Your Future With 9 Rock-Solid Dividend Stocks," including one above-average retailing powerhouse. Click here for instant access to this free report.
We can help you keep tabs on your companies with My Watchlist, our free, personalized stock tracking service.
Add Winmark to My Watchlist.Wednesday, December 24, 2014
Will These Numbers from Alcoa Be Good Enough for You?
Alcoa (NYSE: AA ) is expected to report Q1 earnings on April 8. Here's what Wall Street wants to see:
The 10-second takeaway
Comparing the upcoming quarter to the prior-year quarter, average analyst estimates predict Alcoa's revenues will decrease -2.0% and EPS will wane 0.0%.
The average estimate for revenue is $5.89 billion. On the bottom line, the average EPS estimate is $0.10.
Revenue details
Last quarter, Alcoa logged revenue of $5.90 billion. GAAP reported sales were 1.5% lower than the prior-year quarter's $5.99 billion.

Source: S&P Capital IQ. Quarterly periods. Dollar amounts in millions. Non-GAAP figures may vary to maintain comparability with estimates.
EPS details
Last quarter, non-GAAP EPS came in at $0.06. GAAP EPS were $0.21 for Q4 compared to -$0.18 per share for the prior-year quarter.

Source: S&P Capital IQ. Quarterly periods. Non-GAAP figures may vary to maintain comparability with estimates.
Recent performance
For the preceding quarter, gross margin was 15.8%, 300 basis points better than the prior-year quarter. Operating margin was 4.0%, 260 basis points better than the prior-year quarter. Net margin was 4.1%, 730 basis points better than the prior-year quarter.
Looking ahead
The full year's average estimate for revenue is $24.48 billion. The average EPS estimate is $0.59.
Investor sentiment
The stock has a four-star rating (out of five) at Motley Fool CAPS, with 3,419 members out of 3,662 rating the stock outperform, and 243 members rating it underperform. Among 758 CAPS All-Star picks (recommendations by the highest-ranked CAPS members), 710 give Alcoa a green thumbs-up, and 48 give it a red thumbs-down.
Of Wall Street recommendations tracked by S&P Capital IQ, the average opinion on Alcoa is hold, with an average price target of $10.64.
Is Alcoa the right metals stock for you? Find out the best way to profit from inflation and gold with a little-known company we profile in, "The Tiny Gold Stock Digging Up Massive Profits." Click here for instant access to this free report.
Add Alcoa to My Watchlist.Tuesday, December 23, 2014
4 Reasons You Should Consider the Huge Dividend Yield at American Capital Agency Corporation
Mortgage REITs have had a good run so far in 2014; they have benefited from a return of investor confidence. Exemplifying this difference from last year, shares of American Capital Agency Corporation (NASDAQ: AGNC ) are up 18% this year, and shares of its largest competitor, Annaly Capital Management (NYSE: NLY ) , increased 14%.
Furthermore, with strong book value growth year to date, a less uncertain monetary policy from the Federal Reserve, a history of outperformance, and capital gains potential, investors in American Capital Agency could see an even better 2015.
1. Strong year-to-date book value growth
American Capital Agency's third-quarter earnings were at first glance a bit disappointing on the earnings and book value fronts: The mortgage REIT reported a total loss of $0.07 per share and a 2.7% sequential decline in its book value to $25.54 per share.
While those results may appear weak, especially the decline in book value, they certainly need to be put into context. Since the beginning of the year (that is, since the mortgage REIT reported 2013 fiscal year results), its book value has nonetheless increased a total of 6.7%, driven by strong book value growth of more than 7% in the second quarter.

Source: American Capital Agency Corporation third-quarter results presentation.
American Capital Agency's slight sequential decrease in its book value is forgiven, for two reasons: First, the mortgage REIT already presented investors with a strong year-to-date performance in terms of book value growth.
Second, American Capital Agency's earnings are and will remain volatile. Mortgage REITs, which take out short-term funding to finance the purchase of long-term securities, are inherently risky investments.
Evidence of this risk can be seen in American Capital Agency's earnings per share, which have historically fluctuated wildly. With earnings being volatile, investors need to be prepared for a weak quarter at any time, but that doesn't necessarily affect American Capital Agency's long-term value proposition negatively.
2. History of outperformance
One of the best indicators of future performance is a REIT's past performance. Though a convincing past performance record is no guarantee of future outperformance, it does make a strong case for or against an income investment.
And American Capital Agency doesn't have to shy away from scrutiny: American Capital Agency has outperformed other mortgage REITs over time, both before and after the initiation of the Federal Reserve's latest round of quantitative easing.
American Capital Agency has also returned a massive $29.56 in dividends since the mortgage REIT went public in 2008.
3. Capital gains potential
The uncertainty about the Federal Reserve's future monetary policy led to a broad-based sell-off in shares of mortgage REITs in 2013 as extraordinary pressure on mortgage security portfolios built up.
The return to book value growth in 2014, on the other hand, has again led to a change in investor sentiment, and investors started to come back to American Capital Agency and the sector in hopes that the storm had passed.
Investors always tend to overreact, and share prices of mortgage REITs appear to have fallen way too low, way too quickly in 2013. Though they have somewhat recovered, as evidenced by double-digit year-to-date returns, they are still relatively cheap.
Since both American Capital Agency and Annaly trade at meaningful discounts of 11% and 14% to their respective net asset values, investors can now expect capital gains to contribute to their total return performances going forward.

4. Dividend yields
American Capital Agency currently offers investors a dividend yield of 11.61% (according to S&P Capital IQ), whereas Annaly's is 10.52%.
Capital appreciation potential, in addition to a high dividend yield, only makes a stronger case for income and growth-focused investors to add a mortgage REIT like American Capital Agency to their investment portfolios.
The Foolish bottom line
While American Capital Agency's third-quarter results were a bit disappointing, investors need to look at the bigger picture here. The mortgage REIT operates in a business that regularly sees wildly fluctuating earnings. But American Capital Agency's book value grew a total of 6.7% in 2014, despite the reported book value decline of 2.7% in the third quarter.
Over time, however, American Capital Agency has handsomely outperformed its peers and presented investors with good returns. Given that American Capital Agency still trades at an 11% discount to its accounting book value, and also offers investors a nearly 12% dividend yield, it is an interesting investment for investors who want to accentuate both recurring dividend income and capital growth.
The smart way to get more income in retirement
Getting a part-time job is one way to increase your income in retirement, but it isn't the smart way. In a brand-new free report, our retirement experts explain a straightforward strategy that people are already using to get more income in retirement. The method is so simple you'll be shocked you didn't think of it yourself. To access this free report instantly, simply click here now.
Monday, December 22, 2014
My Credit Card Just Saved Me $1,098 - and a Big Headache

Nike Jumps On Strong Results; Powell Industries Shares Slide
 Related BZSUM Markets Gain; BlackBerry Posts Narrower Loss #PreMarket Primer: Friday, September 26: US Coalition Picks Up A New Supporter
 Midway through trading Friday, the Dow traded up 0.45 percent to 17,021.61 while the NASDAQ surged 0.37 percent to 4,483.37. The S&P also rose, gaining 0.29 percent to 1,971.76.
Leading and Lagging Sectors
In trading on Friday, energy shares gained 0.87 percent. Top gainers in the sector included Petróleo Brasileiro SA (NYSE: PBR), up 5 percent, and Hercules Offshore (NASDAQ: HERO), up 4.8 percent.
Healthcare shares fell 0.13 percent on Friday. Top losers in the sector included AcelRx Pharmaceuticals (NASDAQ: ACRX), down 18 percent, and Repligen (NASDAQ: RGEN), off 3.7 percent.
Top Headline
BlackBerry (NASDAQ: BBRY) reported a narrower-than-expected second-quarter loss.
The Waterloo, Canada-based company posted a quarterly net loss of $207 million, or $0.39 per share, versus a year-ago loss of $965 million, or $1.84 per share. Excluding non-recurring items, it posted an adjusted loss of $0.02 per share.
Its revenue declined to $916 million from $1.57 billion. However, analysts were expecting a loss of $0.16 per share on revenue of $942.93 million.
Equities Trading UP
Janus Capital Group (NYSE: JNS) shares shot up 34.47 percent to $14.94 following news that Bill Gross will be joining the company. PIMCO also confirmed the departure of Bill Gross.
Shares of Nike (NYSE: NKE) got a boost, shooting up 10.66 percent to $88.25 after the company reported stronger-than-expected fiscal first-quarter results. Analysts at Janney Capital upgraded Nike from Neutral to Buy.
Micron Technology (NASDAQ: MU) shares were also up, gaining 6.28 percent to $33.69 after the company posted better-than-expected fiscal fourth-quarter results and issued a strong revenue forecast for the fiscal first quarter.
Equities Trading DOWN
Shares of Finish Line (NASDAQ: FINL) were down 12.51 percent to $25.73 after the company reported downbeat second-quarter results.
Powell Industries (NASDAQ: POWL) shares tumbled 8.93 percent to $45.28 after the company lowered its FY14 outlook.
Philip Morris International (NYSE: PM) was down, falling 1.02 percent to $82.85. Analysts at Bank of America downgraded Philip Morris International from Buy to Neutral and lowered the target price to $87.
Commodities
In commodity news, oil traded up 0.50 percent to $92.99, while gold traded down 0.52 percent to $1,215.50.
Silver traded up 0.64 percent Friday to $17.55, while copper rose 0.21 percent to $3.04.
Eurozone
European shares were higher today. The eurozone’s STOXX 600 gained 0.25 percent, the Spanish Ibex Index rose 0.63 percent, while Italy’s FTSE MIB Index surged 1.88 percent. Meanwhile, the German DAX dropped 0.10 percent and the French CAC 40 rose 0.91 percent while UK shares rose 0.28 percent.
Economics
The US economy expanded at an annual pace of 4.6% in the second quarter, versus a prior reading of 4.2% growth.
The Reuters/University of Michigan's consumer sentiment index came in flat at 84.60 in September, versus economists’ expectations for a reading of 84.80.
Posted-In: Earnings News Guidance Eurozone Futures Commodities Markets
© 2014 Benzinga.com. Benzinga does not provide investment advice. All rights reserved.
Related Articles (ACRX + BBRY) Nike Jumps On Strong Results; Powell Industries Shares Slide BlackBerry Ltd Conference Highlights Markets Gain; BlackBerry Posts Narrower Loss Stocks Hitting 52-Week Lows What Wall Street Thinks Of BlackBerry Ltd Morning Market LosersSunday, December 21, 2014
What WWE Can Teach Us about Streaming Video
No company is taking a bigger gamble on streaming video than World Wrestling Entertainment (WWE), the venerable professional wrestling organization run by Vince McMahon. The WWE has staked its future and seemingly sacrificed part of its core business to fund a streaming video operation called the WWE Network.
The WWE's experiences in the world of streaming video can supply some really good lessons for investors looking at this growing field. The wrestling venue's successes and failures in streaming video can give us a preview of what other entertainment and sports companies might expect in streaming video.
A few of the basic lessons we can learn from the WWE Network, which went live on Feb. 24, 2014, include:
Streaming video can increase a company's revenue. On March 30, 2014, right after WWE Network appeared, World Wrestling Entertainment reported a TTM revenue figure of $509.54 million for the first quarter of 2014. On June 30, 2014, WWE reported a TTM revenue figure of $513.57 million. The company's revenues grew by $4.3 million. Building a stable audience for streaming video is tough. The WWE managed to sign up 700,000 paying subscribers by June 30, 2014. Yet Variety.com reported that it had lost 128,000 subscribers between April 6 and June 30. Convincing consumers, even diehard wrestling fans, to spend money on streaming video subscriptions is hard. WWE found its fans balked at paying $9.99 a month (around the cost of a Chipotle dinner) for a six-month subscription. World Wrestling is now trying to lure fans with a no-commitment monthly subscription of $12.99 that is supposed to rise to $19.99 at some point in the future. Broadcast, satellite, and cable TV are not dead yet, and they will fight back against streaming video. Satellite TV companies Dish Network (DISH) and DirecTV Group (DTV) refused to carry WWE's pay per view events unless it killed WWE Network. The satellite companies did this because wrestling is still one of the highest rated programs on basic cable and satellite. Supplying cheap programming through streaming video can hurt your core business. Historically, some of WWE's biggest revenue generators have been pay per view events—major wrestling shows featuring big matches between top stars that cable and satellite viewers pay extra to watch. Since WWE Network started streaming pay per views live for just $9.99, pay per view revenues and ratings have collapsed. The June 2013 Payback pay per view attracted 186,000 buyers; only 67,000 pay per view fans tuned into the June 2014 Payback event. Overall, WWE's pay per view revenues have fallen by 39%, according to The Philadelphia Inquirer. Streaming video is not automatically profitable. On August 1, 2014, WWE announced that it will cut its workforce by 7%, or 40 to 60 employees, to make up for a $14.5 million net loss. The loss compares to the $5.2 million net profit WWE made last summer. It looks like the TTM revenue increases didn't translate into automatic profit or cash for WWE. Streaming video won't automatically boost your stock value, even with the experiences of Netflix (NFLX). A month after WWE Network went live, WWE's share price shot up to a high of $31.39 on March 21, 2014; by May 21, 2014, it had fallen to $10.85. Over the summer it had inched up to $14.37 a share by August 19, 2014. Building a streaming video audience can take a lot of time. World Wrestling executives believe they will need 1.3 to 1.4 million subscriptions for the WWE Network to break even, The Wall Street Journal reported. That means they will need to double the size of their subscriber base just to stay online. The company still has a way to go to achieve that number; its current goal is one million subscribers by January 2015. Technical problems can drive subscribers away. The Inquisitir website reported that many WWE Network subscribers had a hard time watching the SummerSlam pay per view even online on August 17, 2014. That's bad news because SummerSlam is WWE's second biggest event of the year. Fans were complaining about apps that didn't work, long load times, crashes, and poor connections. It isn't clear how much of the problems were WWE's fault and how much of it was caused by fans'Internet connections. Many fans were ready to cancel subscriptions because of the trouble.Why the WWE Network Could Be Entertainment's Future
The WWE Network experiment is an interesting one that bears watching because it is fundamentally different than what Netflix and Amazon.com Inc. (AMZN) are trying to do. WWE is going after a niche market (albeit a historically profitable and loyal one) and marketing to a largely working class fan base. Netflix's streaming video service is largely aimed at upper middle class viewers with more disposable income—the kind of people who watch House of Cards—not the working folk who tune into Raw or Smackdown.
World Wrestling Entertainment also lacks the resources available to companies like Netflix. On August 19, 2014, WWE had a market cap of $1.085 billion; the last TTM revenue figure reported for the company was $513.57 million. Netflix reported a TTM revenue figure of $4.892 billion on June 30, 2014; Netflix also had a market capitalization of $27.91 billion on August 19, 2014.
That's why WWE has to lay off employees just to keep its streaming video operation afloat. Yet there is logic to its strategy because the potential revenues from streaming video are enormous. One million streaming video subscriptions at $9.99 a month translates to $9.99 million a month, or $83.88 million a year. 1.4 million streaming video subscriptions at $9.99 a month—the WWE's goal—translates to $13.986 million a month, or $167.832 million a year, in additional revenue.
If it is successful, the WWE Network could generate a lot of revenue for those investors willing to stick around. It could also create a successful business model that other entertainment and sports venues, such as the NFL, NASCAR, the NBA, or the Premier League, could imitate.
About the author:muhammadbazilMuhammad Bazil is a financial journalist and editor for a variety of websites, public policy organizations, and book publishers. He has written hundreds of published articles and blog posts on topics including buSaturday, December 20, 2014
5 Large-Cap Stocks to Trade for Earnings Season Gains
BALTIMORE (Stockpickr) -- The S&P 500 pushed its way into new highs yesterday, ending Wednesday's session at a new record once again. That new high water mark for stocks comes in spite of some serious macro headwinds -- and we've got earnings to thank for it.
Read More: Warren Buffett's Top 25 Stocks for 2014
In fact, so far, this has been one of the most successful earnings seasons of the last few years. With nearly half of the firms in the S&P 500 already reported, 77% of those have beaten analyst estimates for the second quarter. That overwhelming beat rate is a big factor in the S&P's continued run higher, and it's trickling down to create tradable setups in the individual names this week.
That's why, today, we're turning to the charts for a technical look at five big stocks to trade for gains.
If you're new to technical analysis, here's the executive summary.
Read More: Hedge Funds Hate These 5 Stocks -- Should You?
Technicals are a study of the market itself. Since the market is ultimately the only mechanism that determines a stock's price, technical analysis is a valuable tool even in the roughest of trading conditions. Technical charts are used every day by proprietary trading floors, Wall Street's biggest financial firms, and individual investors to get an edge on the market. And research shows that skilled technical traders can bank gains as much as 90% of the time.
Every week, I take an in-depth look at big names that are telling important technical stories. Here's this week's look at five high-volume stocks to trade this week.
Delphi Automotive
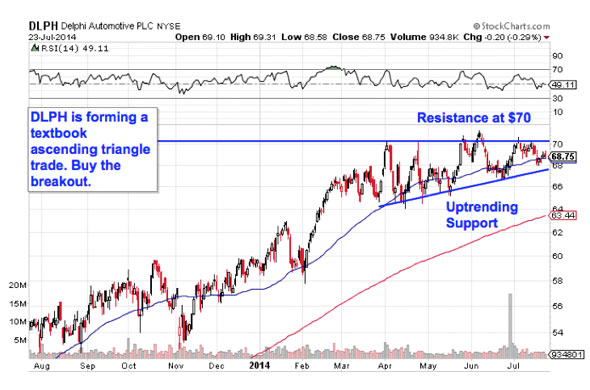
Up first on our list of large-cap trades is Delphi Automotive (DLPH), a name that's already turned out some strong performance in 2014. Year-to-date, Delphi has rallied more than 14%, doubling the S&P's gains over that same stretch.
But don't worry if you've missed the move so far. DLPH looks ready to kick off a second rally leg this summer. Here's how to trade it.
Delphi is currently forming an ascending triangle pattern, a bullish price setup that's formed by horizontal resistance above shares (at $70) and uptrending support to the downside. Put simply, as this stock bounces in between those two technically-important price levels, it's getting squeezed closer to a breakout above that $70 price ceiling. When that breakout happens, it's time to be a buyer.
Read More: 5 Rocket Stocks for Blastoff Gains
The 50-day moving average has been a pretty good proxy for support over the course of this setup (even if it's been a little high), making it a logical place to keep a protective stop in Delphi. I'd recommend locking your stop loss $1 below the 50-day to avoid false stop-outs.
Henry Schein

We're seeing the exact same price setup in shares of $10 billion health care vendor Henry Schein (HSIC). Like Delphi, HSIC is currently forming an ascending triangle setup, in this case with resistance up at the $120 level. While this pattern has been setting up for longer than the one in DLPH, the trading implications are exactly the same: buy the breakout above $120.
Why all of that significance at that $120 level? It all comes down to buyers and sellers. Price patterns are a good quick way to identify what's going on in the price action, but they're not the actual reason a stock is tradable. Instead, the "why" comes down to basic supply and demand for Henry Schein's stock.
Read More: 5 Hated Earnings Stocks You Should Love
The $120 resistance level is a price where there has been an excess of supply of shares; in other words, it's a spot where sellers have previously been more eager to step in and take gains than buyers have been to buy. That's what makes a breakout above $120 so significant -- the move means that buyers are finally strong enough to absorb all of the excess supply above that price level. Since this is a longer-developing setup, the 200-day moving average is a more appropriate place to park a stop loss.
China Mobile
At a glance, Chinese communications giant China Mobile (CHL) hasn't done much this year. Since the calendar flipped to January, shares of CHL have only managed to move 4% higher. But it hasn't been a tepid climb; CHL sold off into the first quarter, only to rebound hard starting at the end of March. Now China Mobile is a "buy-the-dips stock," and you don't need to be an expert technical trader to see why.
Read More: 5 Stocks Insiders Love Right Now
The price setup in China Mobile is about as basic as they get. Shares of the $218 billion phone carrier are bouncing their way higher in an uptrending channel, a pair of parallel trend lines that identify the high-probability range for shares of CHL to stay within. When it comes to trend channels, up is good and down is bad -- it's really just as simple as that. And because every test of trend line support has shown traders an optimal entry opportunity in CHL, it makes sense to hold out for the next correction back down to support.
Put another way, CHL is a buy-the-dips stock, but we've got to wait for the next dip.
For China Mobile, the side indicator to watch is relative strength, the lower subchart on the chart above. CHL's relative strength line has kept its uptrend intact since March, which means that this stock isn't just moving higher -- it's also outperforming the S&P 500 along the way. As long as relative strength keeps making higher lows, this stock should keep beating the rest of the market.
BP
Integrated oil and gas giant BP (BP) may not have much in common with a firm such as China Mobile, but it is basically showing traders the exact same price chart right now. The key difference is that BP's chart is coming off of the fourth test of trend line support since the start of the year. It makes sense to buy that bounce this week.
Read More: 5 Stocks Ready for Breakouts
Waiting for a bounce is important for two key reasons: It's the spot where shares have the furthest to move up before they hit resistance, and it's the spot where the risk is the least (because shares have the least room to move lower before you know you're wrong). Remember, all trend lines do eventually break, but by actually waiting for the bounce to happen first, you're ensuring BP can actually still catch a bid along that line before you put your money on shares.
We've already seen the bounce in BP. Buyers should just be sure to keep a stop on the other side of that blue trend line support level. If it gets violated somewhere along the way, the uptrend is broken, and you won't want to own this trade anymore.
As of the most recently reported quarter ended March 31, BP was one of Seth Klarman's top holdings and also showed up in David Einhorn's Greenlight Capital portfolio.
Rockwell Automation
Last up on our list of big-name trades is $17 billion industrial automation stock Rockwell Automation (ROK). Rockwell is looking bullish thanks to a classic technical pattern that started forming in shares back in March. Now the breakout level to watch is up at $127.50.
Read More: 3 Stocks Rising on Unusual Volume
ROK is forming an inverse head and shoulders pattern, a technical setup that indicates exhaustion among sellers. The pattern is formed by two swing lows that bottom out around the same level (the shoulders), separated by a bigger trough called the head; the buy signal comes on the breakout above the pattern's "neckline" level, currently right at $127.50 resistance. This isn't a textbook pattern (it's coming in at the top of ROK's recent range, not the bottom), but that doesn't change the trading implications on a move through the $127.50 level.
Momentum, measured by 14-day RSI, is the confirming indicator to look at in this stock. Our momentum gauge has been making higher lows all year long, making its way higher in a shallow uptrend – since momentum is a leading indicator of price, it adds some confidence to an upcoming breakout in ROK. When $127.50 gets taken out, it becomes a high-probability buy signal.
To see this week's trades in action, check out the Technical Setups for the Week portfolio on Stockpickr.
-- Written by Jonas Elmerraji in Baltimore.
RELATED LINKS:
>>3 Huge Tech Stocks on Traders' Radars
>>5 Big Stocks to Trade for Gains This Summer
>>4 Stocks Under $10 Making Big Moves Higher
Follow Stockpickr on Twitter and become a fan on Facebook.
At the time of publication, author had no positions in stocks mentioned.
Jonas Elmerraji, CMT, is a senior market analyst at Agora Financial in Baltimore and a contributor to
TheStreet. Before that, he managed a portfolio of stocks for an investment advisory returned 15% in 2008. He has been featured in Forbes , Investor's Business Daily, and on CNBC.com. Jonas holds a degree in financial economics from UMBC and the Chartered Market Technician designation.Follow Jonas on Twitter @JonasElmerraji
Wednesday, December 17, 2014
Coach Inc to Close 70 Stores; Lowers Outlook (COH)
After plummeting almost 9% on Thursday, Coach Inc (COH


The upscale accessory company said than it plans to close 70 stores in North America as sales are expected to fall in the low double digits in percentage terms this year.
Coach current has 351 stores and 193 factory outlets in North America. The company has struggled to keep up with rivals including Michael Kors (KORS) and Kate Spade (KATE).
COH Dividend SnapshotAs market close on June 19, 2014

Click here to see the complete history of COH dividends.
Coach shares were down 37 cents, or 1.04% during pre-market trading Friday. The stock is down 36.42% YTD.